
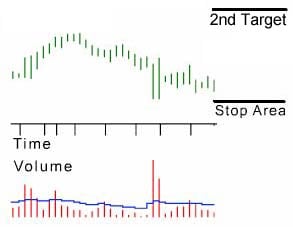
The return to risk ratio shows the location of a GorillaPick, between its stop-loss and first target
Return to Risk Ratio (RTR)
During a bull market, the GorillaTrades portfolio of stock ideas has a tendency to grow quite large. As the Gorilla continues to focus on growth for all of the new stock ideas, it is just as important to focus on the growth and management of older GorillaPicks in the current portfolio. While diversification is imperative, with many positions outperforming the market and remaining technically sound, which are the best positions to maintain when making room for the newest stock ideas?
Introducing….. what might prove to be the most valuable feature of the system…the Return vs. Risk Ratio!
After analyzing many different trading styles and approaches, the Gorilla has chosen to concentrate on the ratio of “Return versus Risk” (RTR). After all, why would one take on the risk of a trade (or fight!) if there was no reward?
The Return to Risk Ratio (RTR) tool enables subscribers to quickly sift through the current portfolio to identify those GorillaPicks that are exhibiting strength greater than the market itself, or to identify those GorillaPicks which are experiencing a non-threatening pullback.
A larger RTR figure indicates that a GorillaPick is closer to its stop-loss level than to its second target. It can also detect GorillaPicks that are experiencing a mild pullback. The higher the number, the greater the risk that a GorillaPick may stop out, but the losses incurred will be small in relation to the potential rewards.
A smaller RTR figure indicates that a GorillaPick is closer to its second target than it is to its stop-loss level. These GorillaPicks are exhibiting strength versus the overall market. The smaller the number, the less risk there is that a GorillaPick will stop out. The losses incurred may be larger in relation to the potential rewards.
Example: A common approach to any trade consideration would be finding those current, confirmed GorillaPicks that still have a high return potential, balanced by-low stop out risk. To calculate the figure in this new column, the figure in the column, “% from second target” is simply divided by the column, “% from stop loss.” While a 2-to-1 ratio is ideal, a 3-to-1 one ratio, or more, is superb! The Gorilla makes this potentially powerful ratio available at a quick glance – just look for a larger RTR figure.
High RTR (Return to Risk Ratio)
Closer to stop loss level than second target
Greater stop out risk, but smaller potential loss
Large potential reward
Can detect GorillaPicks currently experiencing a mild pullback
Chart will generally show a downward sloping entry point, closer to the recommended stop area.

Low RTR (Return to Risk Ratio)
Less stop out risk
Larger potential loss
Less potential reward
Detects GorillaPicks exhibiting strength vs. the overall market
Chart will generally show an upward sloping entry point, closer to potential target.
The Gorilla encourages Gorilla Trades subscribers to be creative using this ratio, but at the same time, to be careful of GorillaPicks that might have extremely attractive Return to Risk Ratios (RTR’s), but are very close to their stop loss levels. This kind of trade could easily result in a very small, but quick loss. Additionally, shy away from GorillaPicks that have not “confirmed“, and are negative in the “unrealized gain/loss column.” And, as always, please view the Gorilla’s figures as guidelines, and note each GorillaPick’s “Risk Rating“.